

🪵 When Did Buffett Get Rich?
Check The (Natural) Log Book...


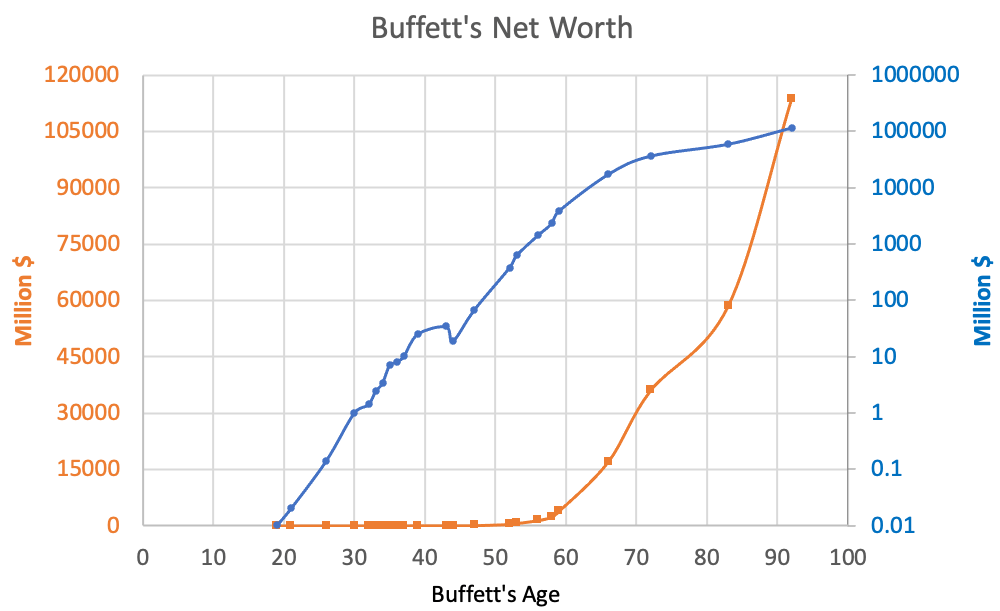
Buffett’s Riches: A Log Look At The Log Book
The Oracle of Omaha followed a “get rich slow” approach — and it worked out pretty well for him. And yet despite a lifetime of successful stock picking, about 90% of Warren Buffett’s wealth came after he turned 65 years old.1 In fact, nearly half of his $110+ billion net worth was gained in just the last 10 years even after investing for over 80 years!
That doesn’t necessarily mean he got any better at investing with age — in fact, he was getting much higher returns in his early days. Nope, this is just the power of exponential growth that appears more strongly towards the end. So did Buffett really cross a threshold to get rich? Or was he just sticking with his get rich slow path the entire time?
Below is a plot of Buffett’s net worth with age.2 There are two curves, but they plot the same exact data — just on a different scale (vertical axis). On the left in orange is the normal (linear) scale. A quick glance seems to suggest Buffett only hit his stride after 60 years old — it looks like that’s when things really started to take off for him!
📈 If It Compounds, Then LOG IT!
One of my biggest pet peeves when looking at financial data — or any data in particular — is when it is not plotted on the proper scale. Looking at the linear scale (orange) data, we may think the GOAT of value investing was fumbling around for 40 years unsuccessfully… but we all know that couldn’t be further from the truth!
Now look at the same data plotted again using the logarithmic scale in blue on the right vertical axis. Without going into the math, the log scale compresses the vertical axis so it is easy to see over a huge range of numbers. Most importantly for our purposes: compounding = straight lines. A curve of true exponential growth looks like a simple straight line that is easy to pick out with the naked eye.
The log scale then tells a different story: Buffett’s rate of growth was actually fastest before 60 years old, steadily compounding in a nearly straight line, and then slowed down in his later years. This could be due to many factors including the sheer size of the money he manages (which limits opportunities) or changes in investing approach. But the takeaway is that when dealing with compounding numbers, we should plot data the right way. That allows us to see the past more clearly, easily draw conclusions from straight lines, and quickly identify exponential growth in all its glory.
Stay Tuned for… Exponential Income
In Stop Checking The Price we plotted revenue (“top line” income from selling goods and services) on the log scale to look for exponential growth. In a future post, we will look at some examples where businesses grow their revenue as well as net income (“bottom line” after expenses) exponentially… and when that exponential rolls over — just like we saw with Buffett’s wealth after 60 — to understand possible implications as investors.
🔍 Want the shortcut to find winning stocks?
Want the tool that makes it easier than ever to find high-quality stocks at non-bubble prices? Check out our 🔍 ValueGlance tool to visualize long-term trends rather than short-term hype!
References:
A. Bary, “Warren Buffett has amassed over 90% of his wealth since he turned 65,” Barrons, March 31st 2022.
“Net worth of Warren Buffett as of August 2015, by age” Statista, December 2014. Added in 2023 data point for $113 billion at age 92.
“Stop Checking The Price!” is now available on Amazon in Kindle and audiobook format. Learn the super simple strategy to find high-quality stocks!