

Quick Stock Analysis: 🛒 Costco (COST)
Key Quality, Value, and Growth Trends
The late great investor Charlie Munger loved great businesses. He understood better than anyone the importance of investing in high-quality stocks for the long run. He put it succinctly:
“Find Costcos, not good exits.”
— Charlie Munger
Costco, the warehouse retailer giant, is known for its customer satisfaction and brand loyalty. The headlines after the latest earnings tell a story of a robust business. But does a great business model necessarily mean a great stock?
Rather than prognosticate on short-term headlines 🔮📰 let’s do a quick analysis of long-term quality, value, and growth trends.
🏰 Quality
Here’s a plot of Return On Invested Capital (ROIC, blue) and Weighted Average Cost of Capital (WACC, orange) going back 10 years. As we learned in 📖 “Stop Checking The Price!” a high, steady, and (ideally) increasing ROIC that is well above WACC shows the company is creating long-term value. Indeed, not only has COST kept ROIC well above WACC, but ROIC is at its highest historical level — a high-quality business!
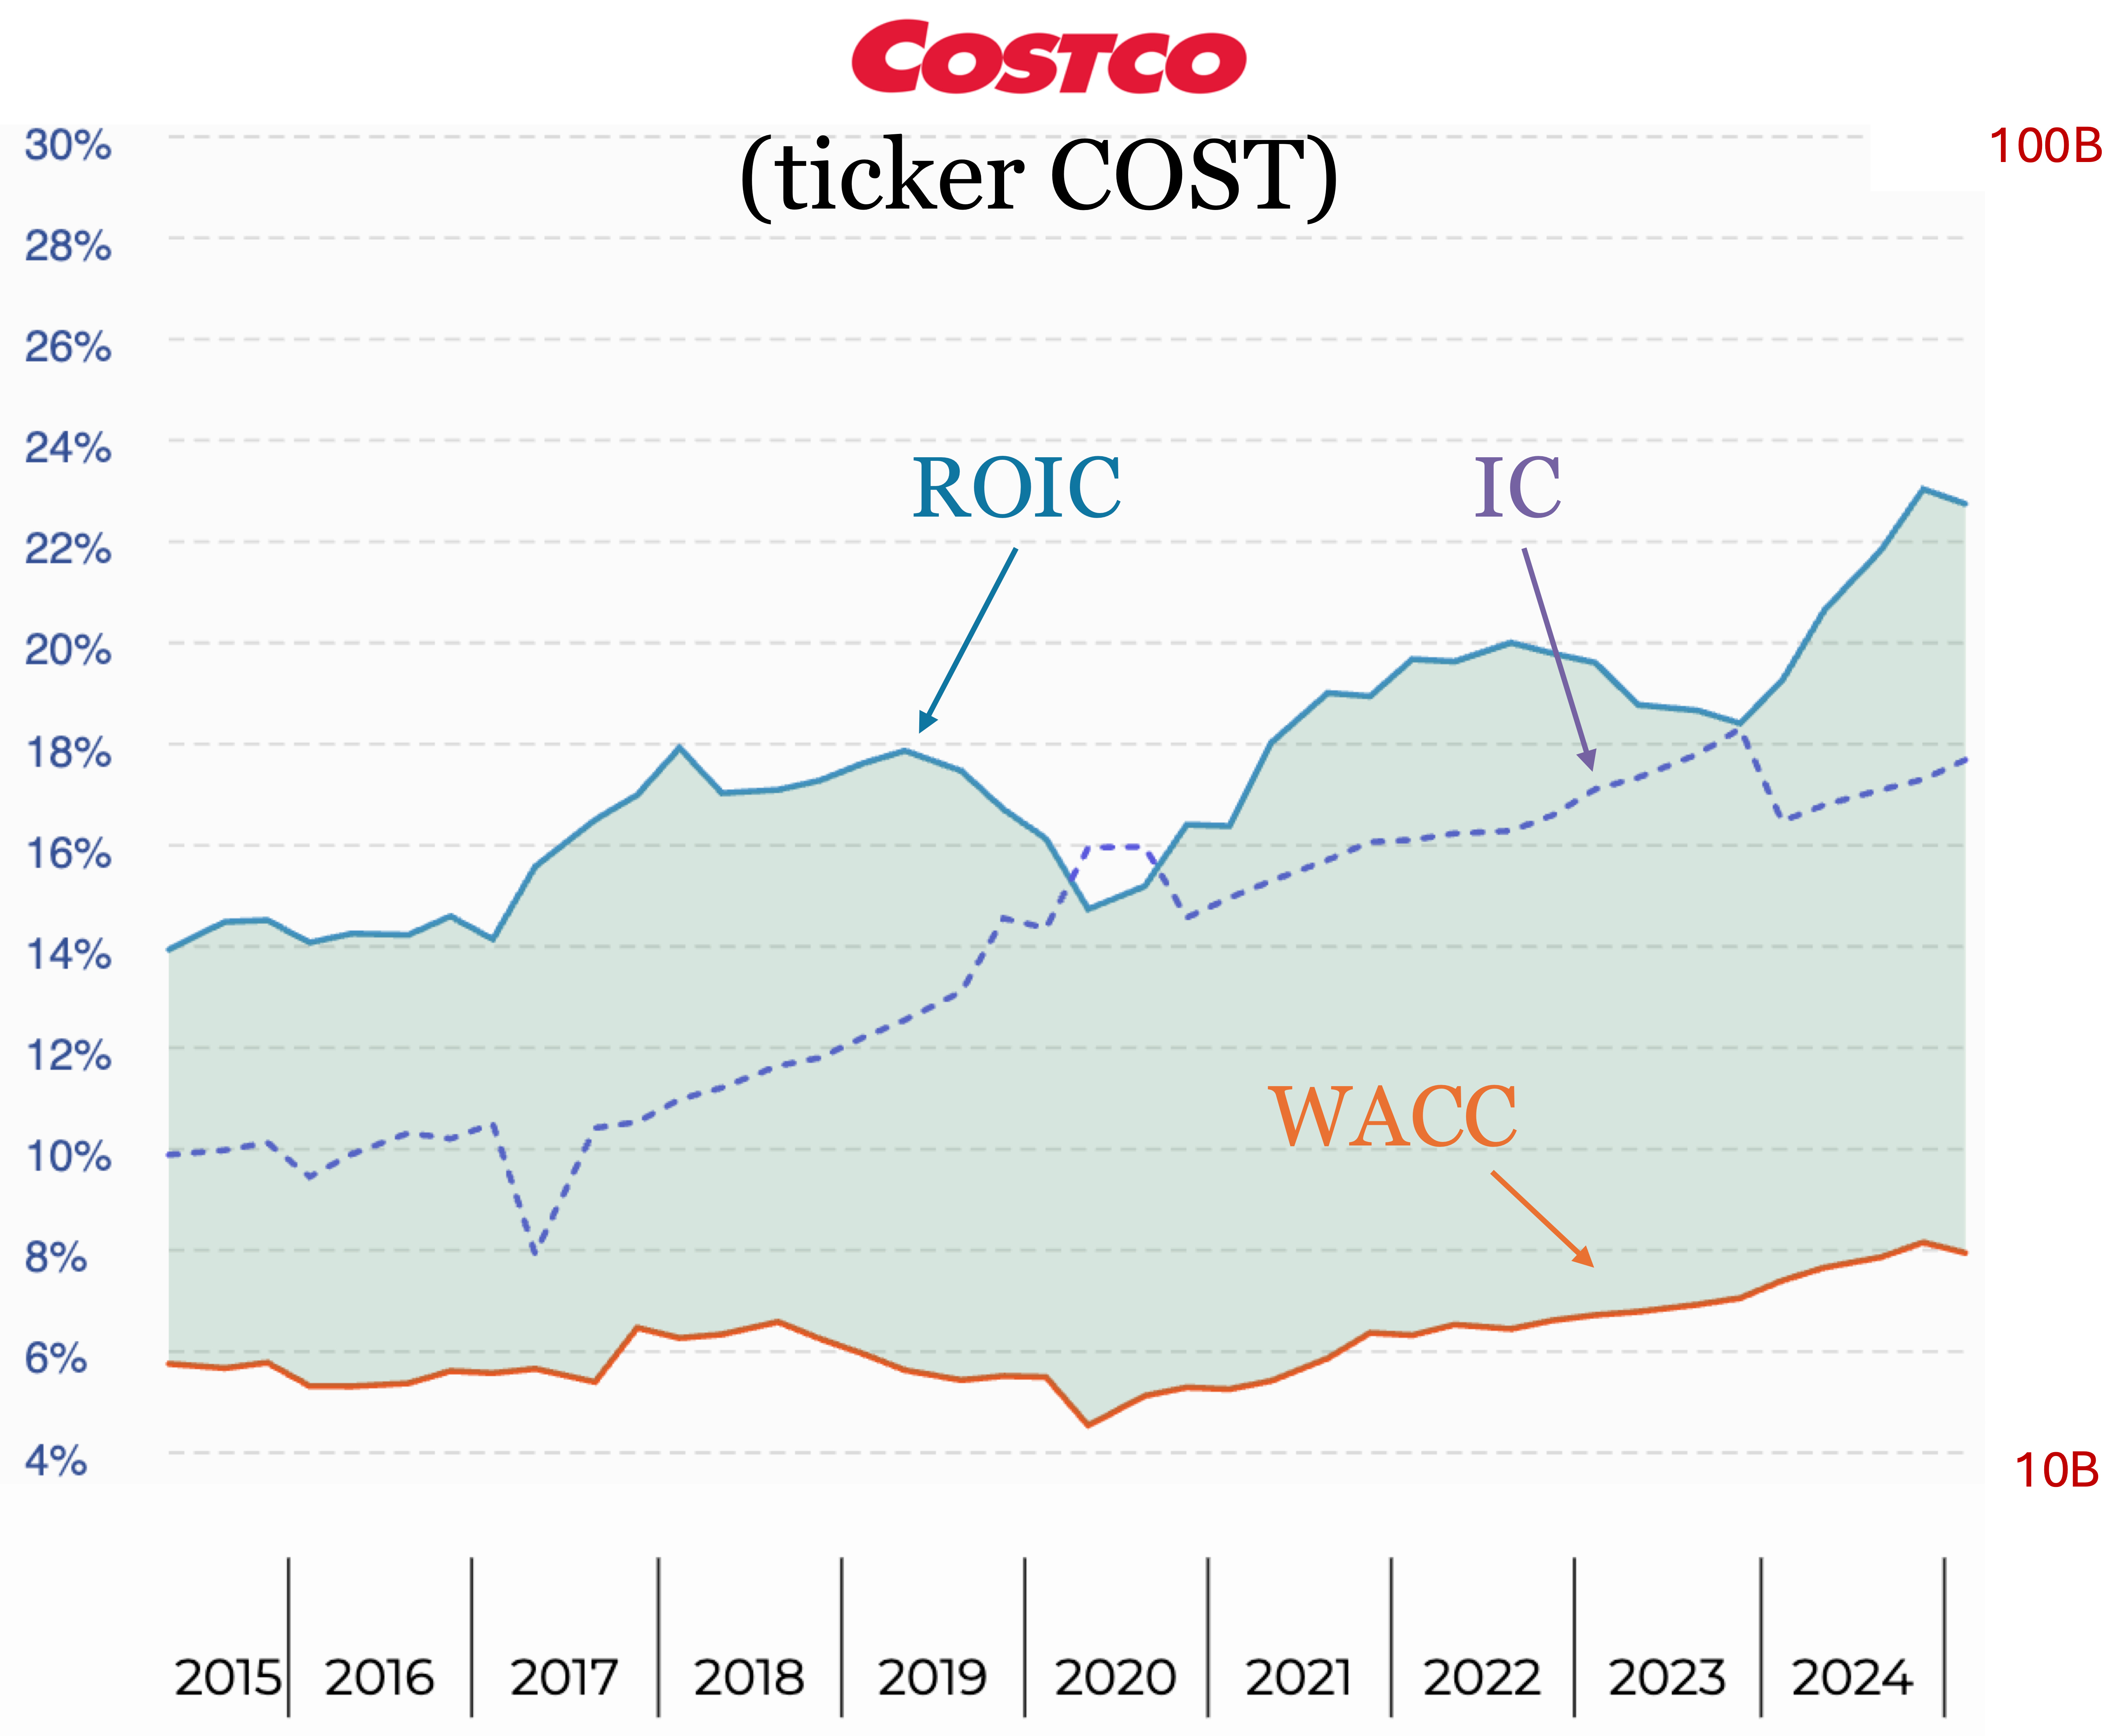
👀 Interesting: Also plotted is Invested Capital (IC, in purple) against the right vertical axis on a log scale. Following our fingerprint of a Compounder stock, COST has maintained ROIC with increasing IC: the business reinvests for growth to create more long-term value.
💰 Value
So how does the market value COST? Here’s a plot of the Hype Factor (green), which is a ratio for the Invested Capital (IC) “acquiring cost” — the market price we pay to acquire the IC divided by the book value of the IC.
The Hype Equilibrium (purple) is the long-term median value. By comparing the Hype Factor with Hype Equilibrium, we get a sense of how IC is valued now compared to how the market valued IC historically.
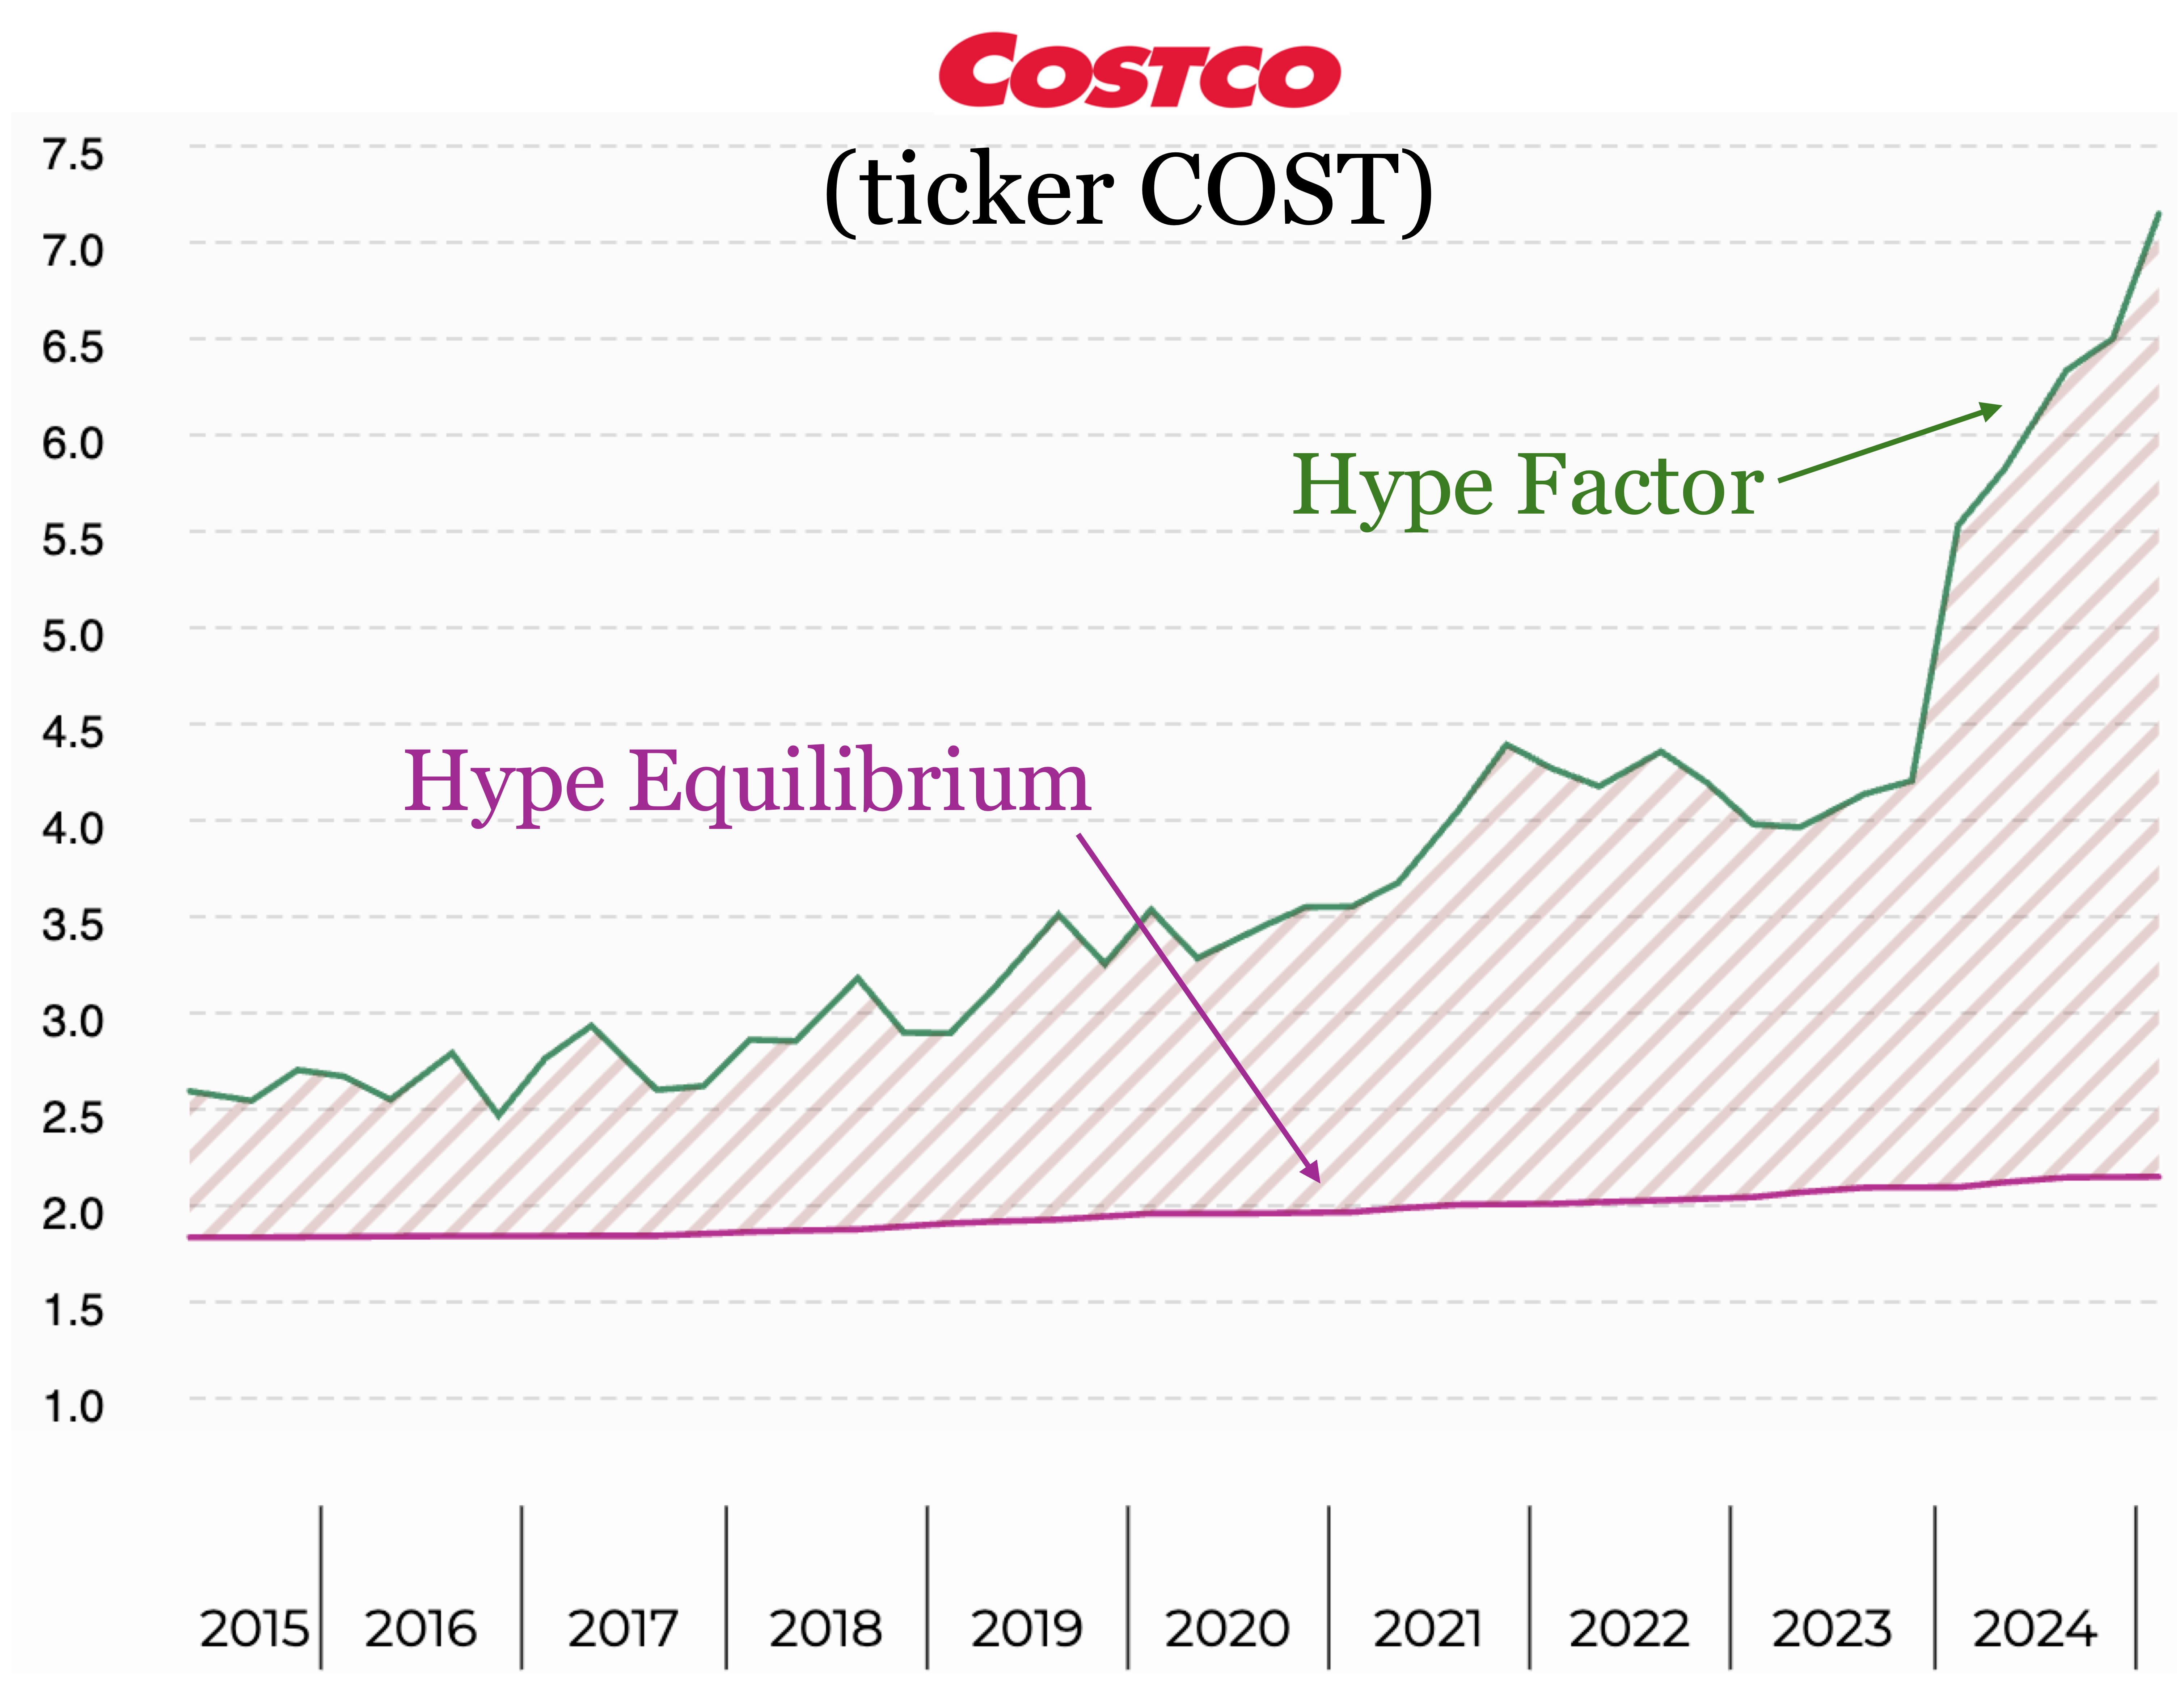
Like Charlie Munger, the market loves COST! The Hype Factor is the highest it has ever been — way above the long-term historical equilibrium value. So this quick analysis suggests the valuation is something to consider: are we getting enough quality business in exchange for the share price valuation?
⚠️ What To Watch: A historically high hype factor doesn’t necessarily mean a bubble that will pop; instead, it could mean slowed growth while the company catches up to (increasingly unrealistic) expectations. After all, no company is immune from competition and limits on growth.
📈 Growth
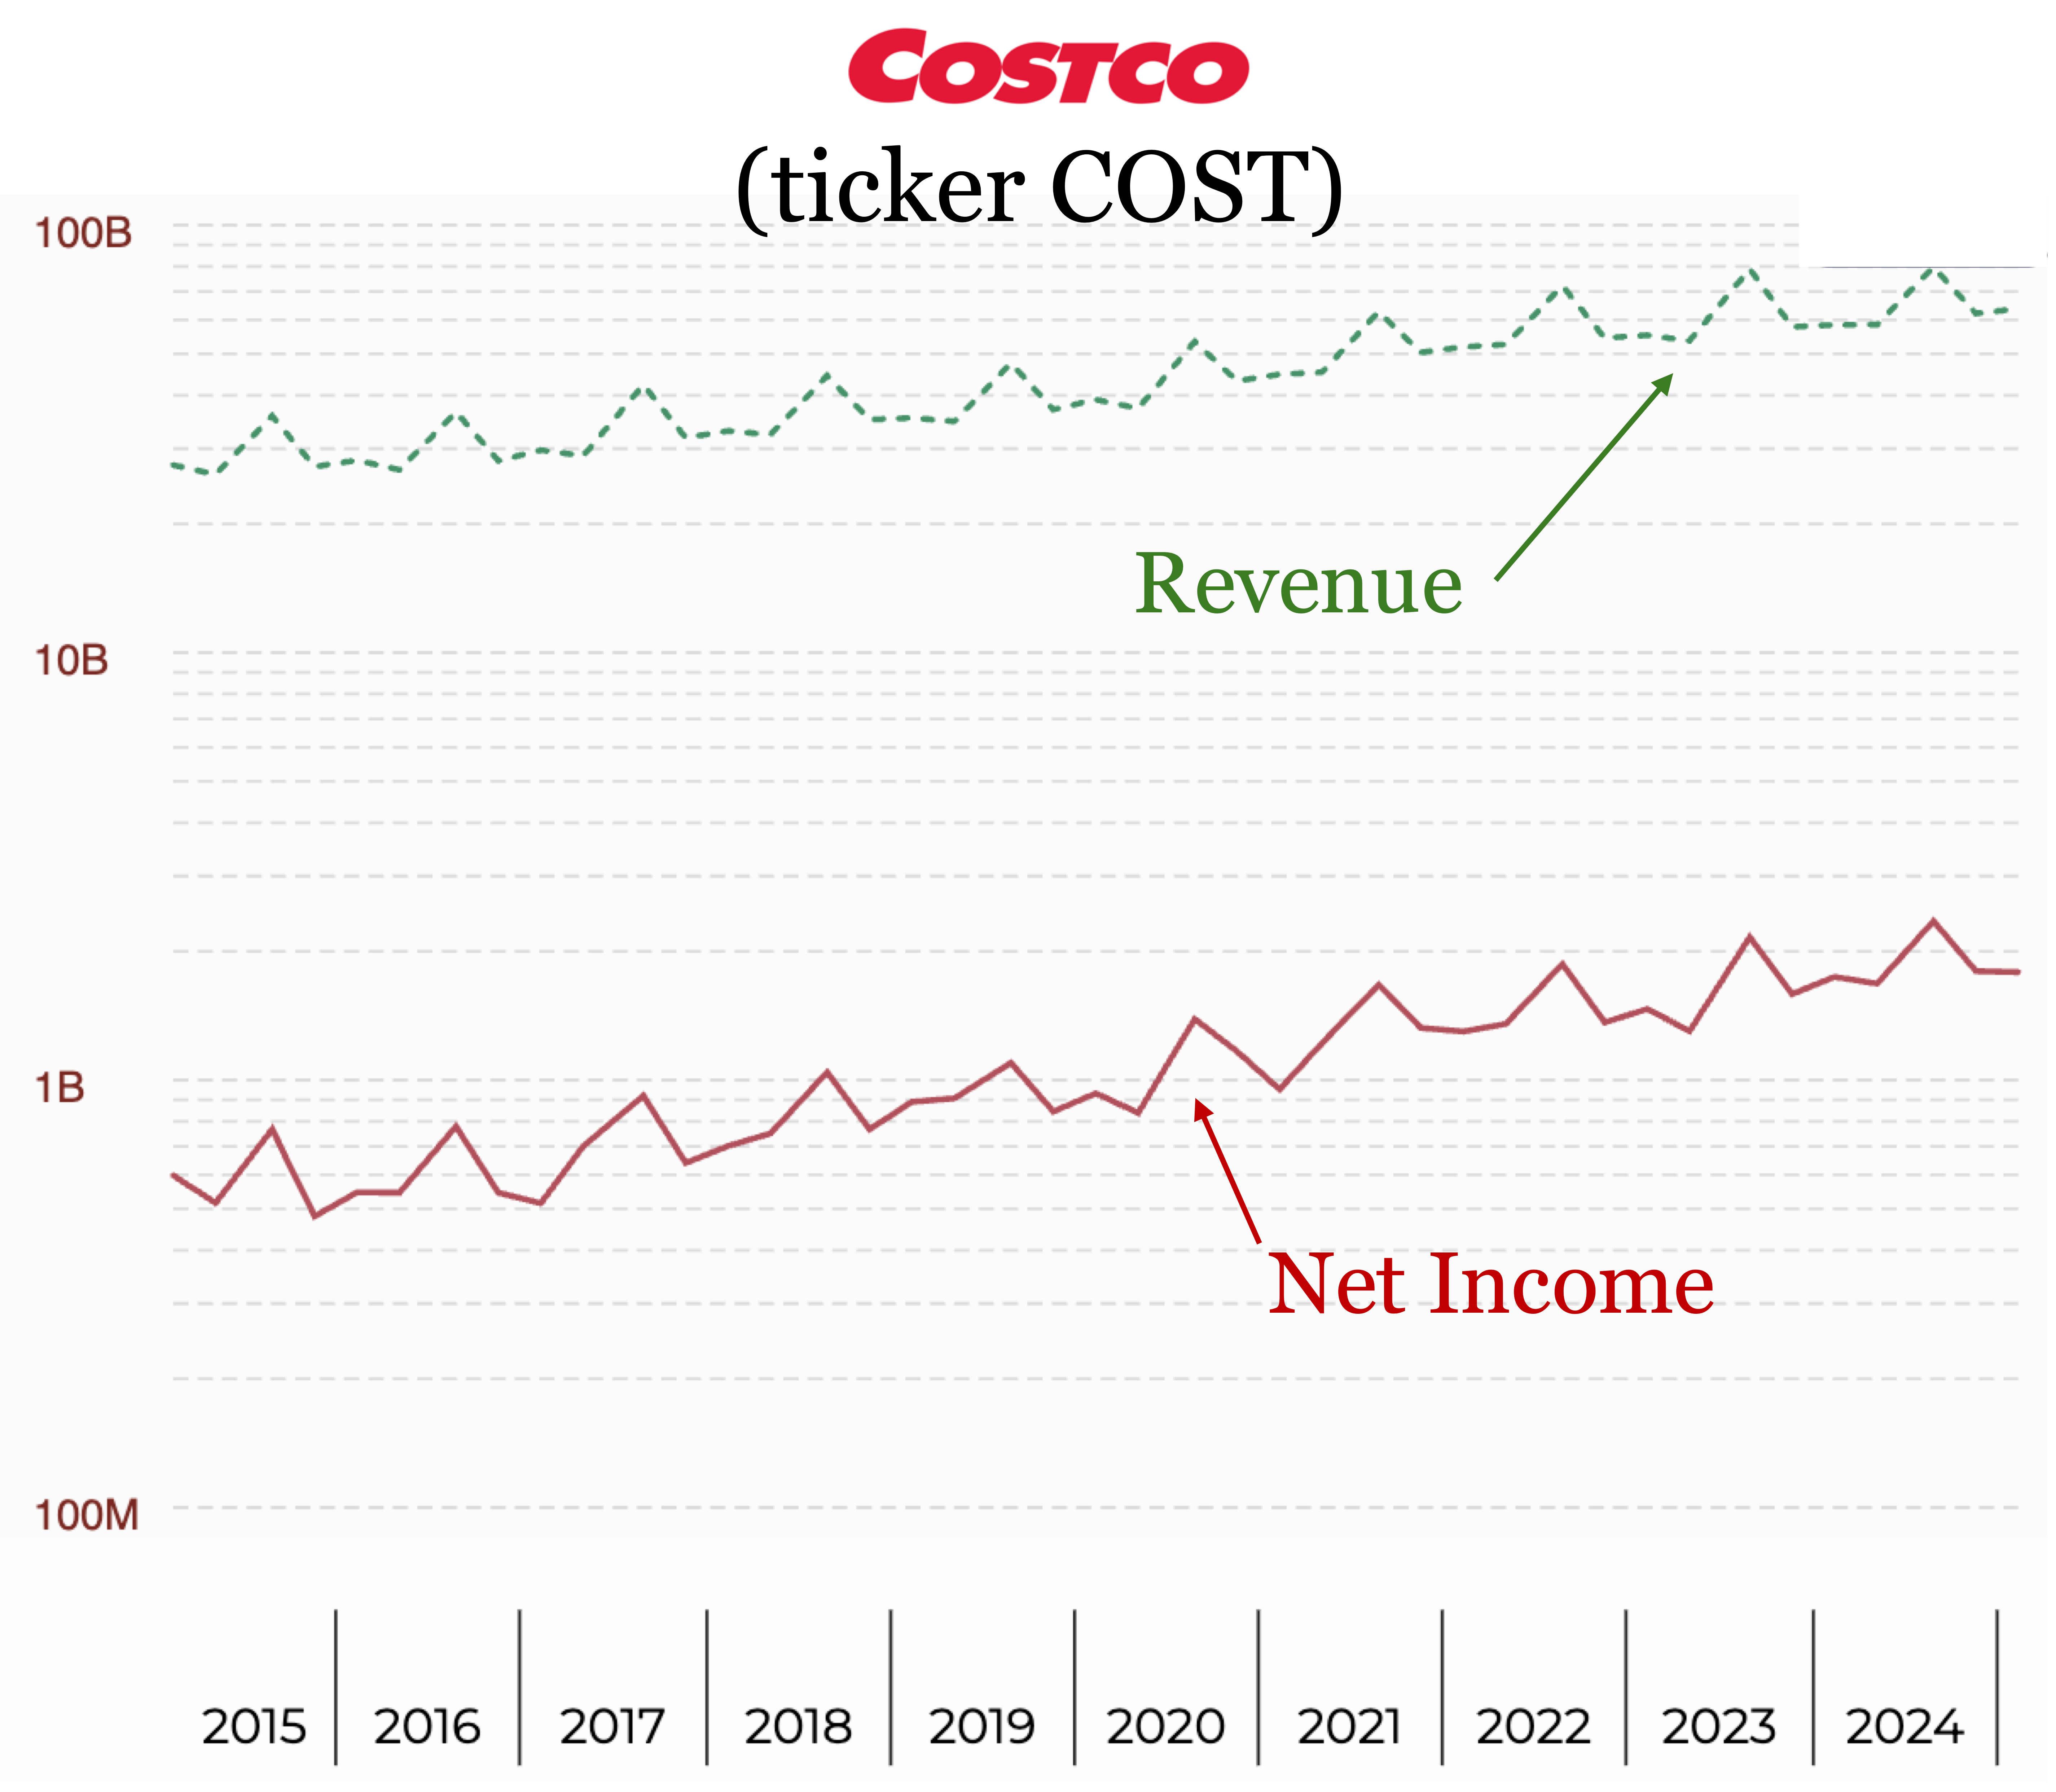
Lastly let’s take a look a growth of top-line Revenue (green) and bottom-line Net Income (red). These are plotted on a vertical log scale, so a straight line would correspond to exponential growth.
We see growth of both the top & bottom lines has been nice and steady. Not explosive growth to the upside — and we may be concerned about growth at a large scale — but nonetheless COST continued to maintain a compound growth trend.
Remember that 🔮 no one can predict the future — especially in the near term — but by studying the long-term trends of key metrics we can avoid getting caught up in the latest nonsense news headlines.
Invest for the long-term and keep compounding knowledge! 📈🧠
📺 Want to follow along on Youtube?
Please check out & subscribe to our 📺 Youtube channel where we will go into detail on these investing topics and more!
🔍 Want to analyze your favorite stock?
Want the tool that makes it easier than ever to find high-quality stocks in deep value territory? Check out 🔍 ValueGlance.com to visualize long-term trends rather than short-term hype!
📖 Want to learn the high-quality stock strategy?
Want to learn the simple strategy to find high-quality, value-creating, money-printing stocks? Get a copy of 📖 “Stop Checking The Price!” on Amazon!